|
Market Closed -
Other stock markets
|
5-day change | 1st Jan Change | ||
| 2,015.00 GBX | +0.55% |
|
+1.61% | +10.44% |
| 07-02 | FTSE 100 up as US jobs data eases rate hike fears | AN |
| 07-01 | London's FTSE 100 inches lower as Middle East concerns weigh | RE |
| Market Cap | 80.29B 107B 93.73B 86.14B 152B 10,209B 155B 1,034B 402B 5,018B 402B 394B 17,292B | P/E 2026 * |
13x | P/E 2027 * | 11.9x |
|---|---|---|---|---|---|
| Enterprise Value | 95.27B 127B 111B 102B 181B 12,114B 183B 1,227B 477B 5,954B 478B 467B 20,519B | EV / Sales 2026 * |
2.81x | EV / Sales 2027 * | 2.59x |
| Free-Float |
92.29% | Yield 2026 * |
3.47% | Yield 2027 * | 3.64% |
Last Transcript: GSK plc

| 1 day | +0.55% | ||
| 1 week | +1.61% | ||
| Current month | +1.72% | ||
| 1 month | +5.94% | ||
| 3 months | -6.02% | ||
| 6 months | +10.02% | ||
| Current year | +10.44% |
| 1 week | 1,930 | 2,015 | |
| 1 month | 1,839 | 2,015 | |
| Current year | 1,690 | 2,282 | |
| 1 year | 1,288.6 | 2,282 | |
| 3 years | 1,242.5 | 2,282 | |
| 5 years | 1,242.5 | 3,408.16 | |
| 10 years | 1,242.5 | 3,408.16 |
| Manager | Title | Age | Since |
|---|---|---|---|
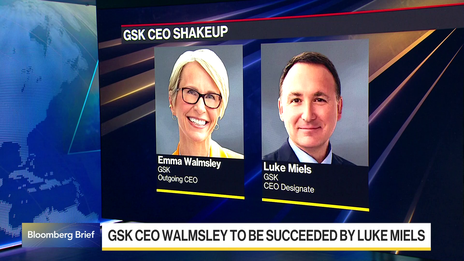
Luke Miels
CEO | Chief Executive Officer | - | 01/01/2026 |
Julie Brown
DFI | Director of Finance/CFO | 64 | 01/05/2023 |
| Chief Tech/Sci/R&D Officer | - | 01/12/2021 |
| Director | Title | Age | Since |
|---|---|---|---|
Luke Miels
BRD | Director/Board Member | - | 06/05/2026 |
Hal Barron
BRD | Director/Board Member | 64 | 01/01/2018 |
Jonathan Symonds
CHM | Chairman | 68 | 01/09/2019 |
| Date | Insider | Type | Main position | Quantity | % Market Cap. | |
|---|---|---|---|---|---|---|
| 06-22 | Buy | Executive/Senior Manager | 9 | 0.0000% | ||
| 06-08 | Buy | Executive/Senior Manager | 9 | 0.0000% | ||
| 05-22 | Buy | Executive/Senior Manager | 9 | 0.0000% |
| Change | 5-day change | 1-year change | 3-year change | Capi.($) | ||
|---|---|---|---|---|---|---|
| +0.55% | +1.61% | +43.42% | +46.12% | 107B | ||
| +1.86% | +0.48% | +55.50% | +163.08% | 1,082B | ||
| +3.57% | +3.29% | +68.60% | +61.03% | 633B | ||
| +3.99% | +3.05% | +37.93% | +93.37% | 461B | ||
| +3.86% | +1.64% | +31.35% | +24.29% | 338B | ||
| -0.56% | +0.96% | +39.86% | +36.64% | 299B | ||
| -0.08% | +1.30% | +30.37% | +44.02% | 291B | ||
| -1.54% | +2.81% | -27.56% | -39.45% | 222B | ||
| +3.55% | +4.41% | +25.45% | +66.28% | 202B | ||
| +4.21% | +2.65% | +17.47% | +71.11% | 163B | ||
| Average | +1.94% | +4.28% | +32.24% | +56.65% | 379.96B | |
| Weighted average by Cap. | +2.20% | +5.42% | +41.83% | +81.96% |
| 2026 * | 2027 * | |
|---|---|---|
| Net sales | 33.86B 45.22B 39.53B 36.33B 64.22B 4,305B 65.2B 436B 170B 2,116B 170B 166B 7,293B | 35.56B 47.48B 41.51B 38.15B 67.45B 4,521B 68.47B 458B 178B 2,222B 178B 174B 7,658B |
| Net income | 6.47B 8.64B 7.55B 6.94B 12.27B 823B 12.46B 83.35B 32.4B 404B 32.44B 31.74B 1,394B | 6.94B 9.26B 8.1B 7.44B 13.15B 882B 13.35B 89.32B 34.72B 433B 34.76B 34.02B 1,494B |
| Net Debt | 14.98B 20.01B 17.49B 16.07B 28.42B 1,905B 28.85B 193B 75.01B 936B 75.09B 73.48B 3,227B | 11.74B 15.67B 13.7B 12.59B 22.26B 1,492B 22.6B 151B 58.76B 734B 58.83B 57.57B 2,528B |
| Date | Price | Change | Volume |
|---|---|---|---|
| 03/07/26 | GBX 2,015.00 | +0.55% | 2,548,759 |
| 02/07/26 | GBX 2,004.00 | +3.83% | 17,567,408 |
| 01/07/26 | GBX 1,930.00 | -2.57% | 8,818,924 |
| 30/06/26 | GBX 1,981.00 | +0.08% | 13,958,407 |
| 29/06/26 | GBX 1,979.50 | -0.18% | 9,719,035 |


Trader
This super rating is the result of a weighted average of the rankings based on the following ratings: Valuation (Composite), EPS Revisions (4 months), and Visibility (Composite). We recommend that you carefully review the associated descriptions.
Investor
This super composite rating is the result of a weighted average of the rankings based on the following ratings: Fundamentals (Composite), Valuation (Composite), EPS Revisions (1 year), and Visibility (Composite). We recommend that you carefully review the associated descriptions.
Global
This composite rating is the result of an average of the rankings based on the following ratings: Fundamentals (Composite), Valuation (Composite), Financial Estimates Revisions (Composite), Consensus (Composite) and Visibility (Composite). The company must be covered by at least 4 of these 5 ratings for the calculation to be carried out. We recommend that you carefully review the associated descriptions.
Quality
This composite rating is the result of an average of rankings based on the following ratings: Returns (Composite), Profitability (Composite) and Quality of Financial Reporting (Composite), and Financial Health (Composite). The company must be covered by at least 2 of these 3 ratings for the calculation to be performed. We recommend that you carefully read the associated descriptions.
ESG MSCI
The MSCI ESG score assesses a company’s environmental, social, and governance practices relative to its industry peers. Companies are rated from CCC (laggard) to AAA (leader). This rating helps investors incorporate sustainability risks and opportunities into their investment decisions.


Quarterly revenue - Rate of surprise

- Stock Market
- Stocks
- GSK Stock
Select your edition
All financial news and data tailored to specific country editions


